AWE Assessment Summary Term 1 2022
Please find below an update/summary of our T1 AWE Wellbeing Survey
Assessing Wellbeing in Education
We have a variety of ways of collecting data (formal and informal) about the wellbeing needs and strengths of our school community. We invested in the AWE survey in August 2020 as the formal tool that we use to measure and track the wellbeing of our school community
Why we use the AWE Survey
AWE assesses individuals’ subjective wellbeing: experiences, feelings, functioning, and perceptions of how their lives are going - both what is going right and what is challenging. The AWE tool provides validated scales via an online survey for staff and students with qualitative and quantitative data. The AWE survey alerts the school of any students who score low for wellbeing or high for bullying and teachers have individual check-ins with these students to identify any further support or intervention that may be needed. The assessment will be repeated again in August this year.
The main focus of the AWE Assessment is to track changes in student wellbeing over time and to determine how effective our wellbeing initiatives are. It allows us to look at what we are doing well and what our next steps are. We use the data to identify focus areas that link to what is being planned for by teachers in the classroom to develop our students’ skills and strategies using our school wellbeing framework.
If you’re interested in learning more, take a look at: www.awesomeschools.com
Measuring Wellbeing Data
Note: With wellbeing data it is difficult to ‘measure gains’ over a short term time period. A short term could be a child's entire time at primary school. Research highlights “that like so much of education the long term impact of wellbeing promotion may not readily be detected, or realised, until many years later” (Quinlan & Hone, p. 142, 2020).
Our School Summary
Our students report high levels of wellbeing and happiness and slightly below-average levels of bullying. Student results show that they feel supported by staff and other students at our school and they feel like they belong to our school community.
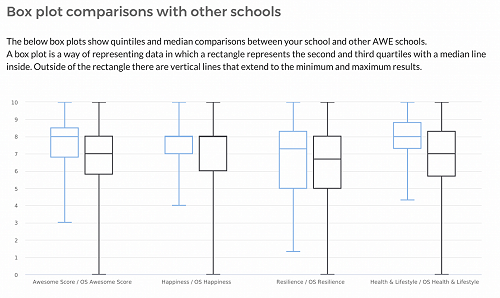
The following graphs (box plots) show comparisons between our school and other schools. The Cashmere primary Te Pae Kererū results are those in blue.
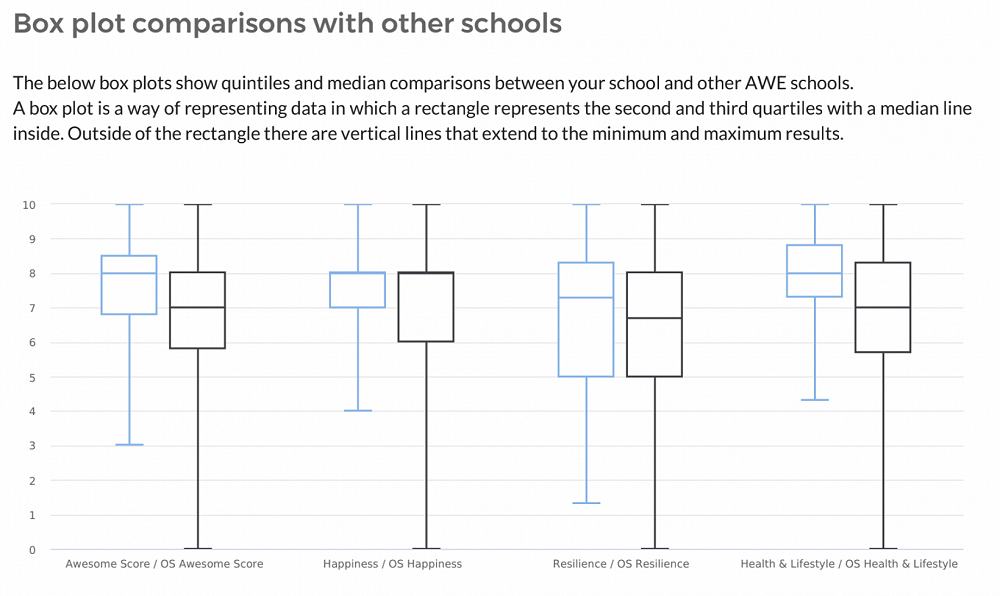
We see these results as a positive sign that the work we are doing on wellbeing is making a difference. Our AWE data also provides us with direction for continual improvement as we embed our framework into our school culture.
Gallery