A Fun Stats Lesson for Young Learners with Numicon and M&Ms!
TPT students engaging in statistics using Numicon shapes and M&M's to explore, collect data, create graphs, and enjoy hands-on learning experiences.
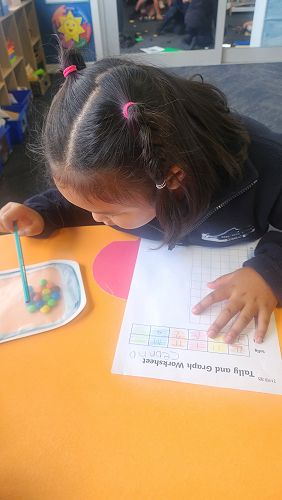
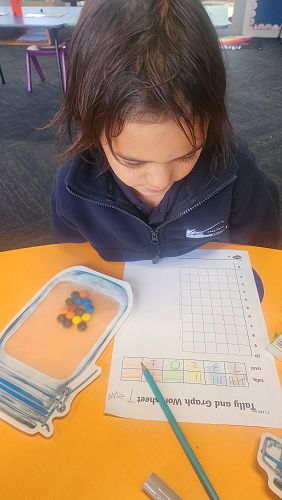
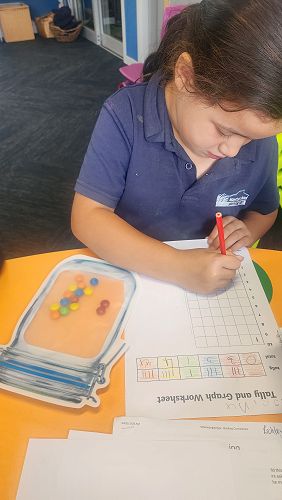
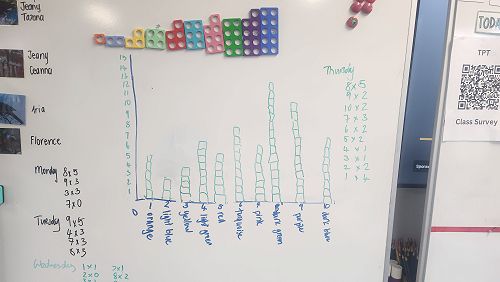
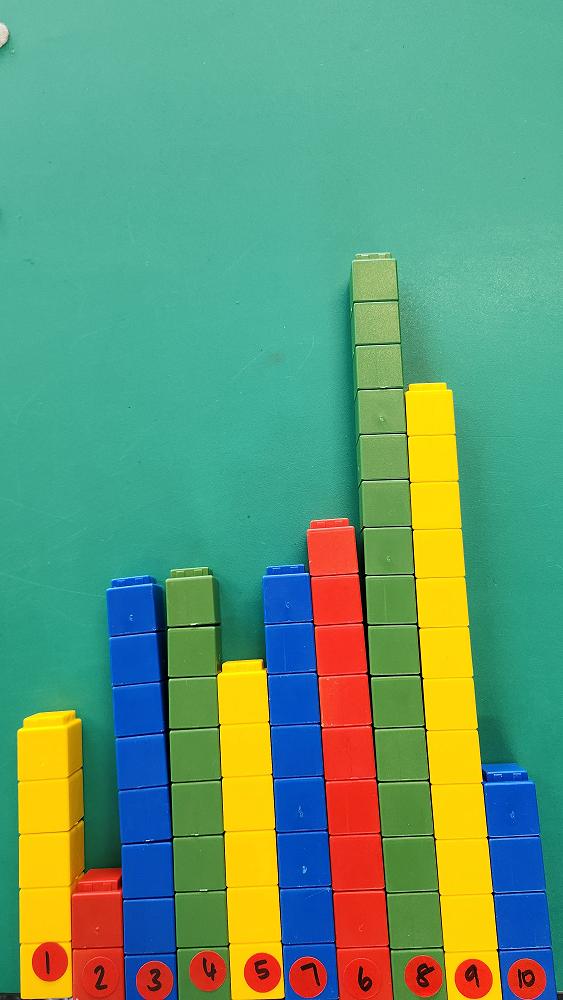
In the exciting world of education, we have embarked on a wonderful journey exploring statistics using Numicon shapes and M&M's! Our young learners have dived into mathematics with fervor, delving into the properties of Numicon shapes and discovering how to describe them in mathematical terms. Through a fun activity spanning a week, we engaged in randomly selecting different shapes, collecting data on their frequency, drawing bar and building tower graphs to visualize the results, and analyzing which shapes appeared most frequently.
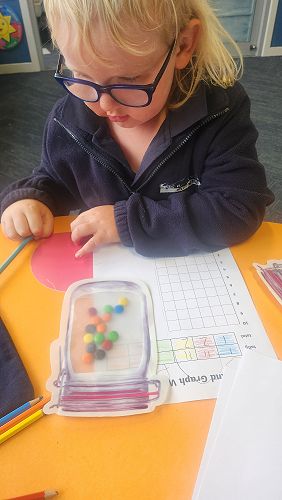
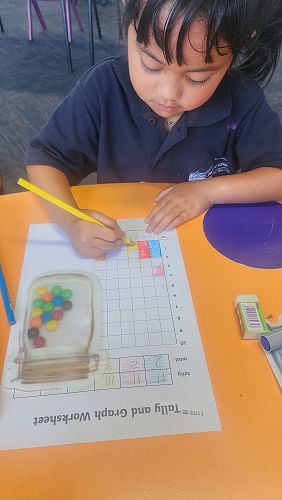
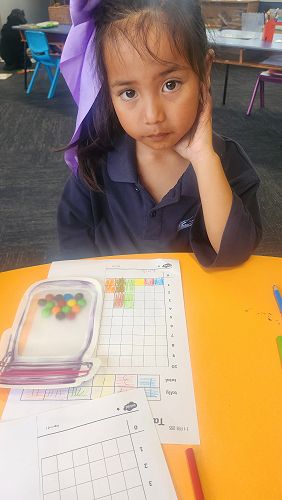
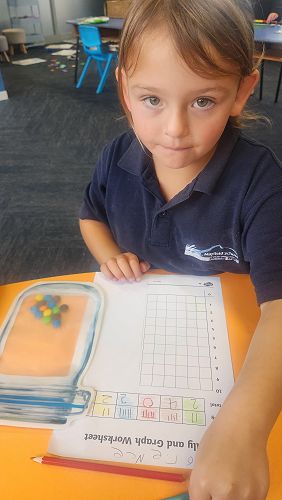
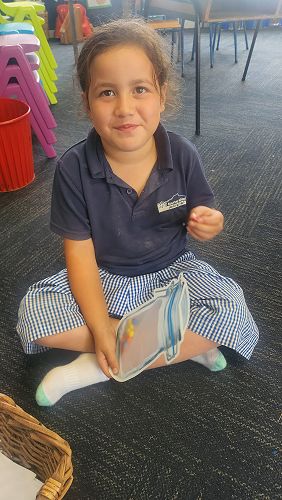
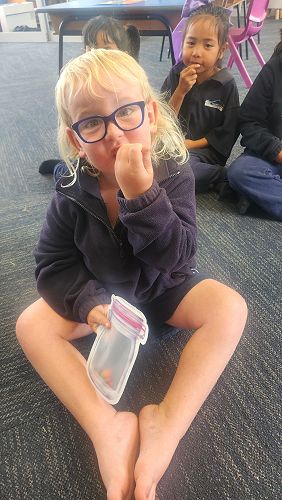
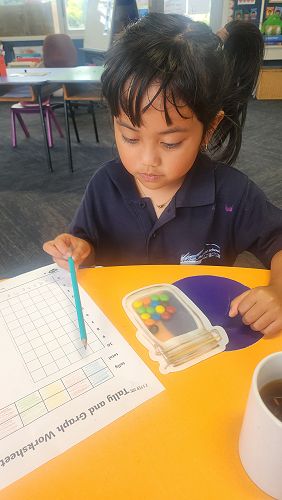
To further enhance our statistical skills, we ventured into the world of M&M's, where each child had the opportunity to delve into a bag of these colorful treats. They meticulously collected data on the colors present, created their own graphs to showcase the distribution of colors, and discovered which colours were most abundant and which were scarce. The best part came after all the analysis – they got to devour their mathematical creations!
This interactive and engaging approach to learning was a fun way to begin our understanding of statistics but also fostered a love for math through hands-on exploration. As we continue on this educational journey, we are excited to unravel more mathematical mysteries and empower our young minds with the joy of learning.
Gallery