Census at School
Over the last few weeks, students from Newlands Intermediate took part in a nationwide census using the database Census at School. Each student had to answer several questions. They varied from actual measurements of themselves to opinions on their favourite ice cream flavour.
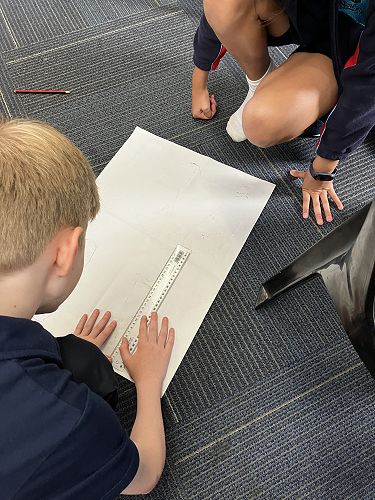
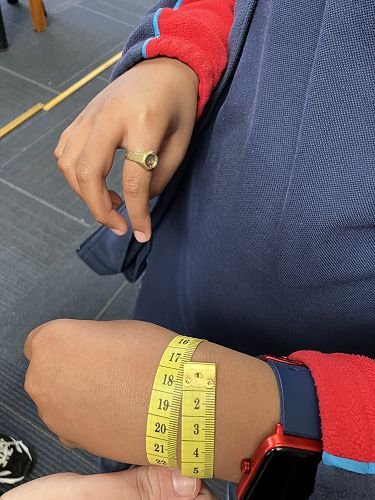
The day before my class began, we had to do a bunch of measurements ranging from how far we could jump to the circumference of our left thumb. We had partners and took the measurements. But later on, several students realised we had gotten the wrong measurements! So Whaea Leanne helped us re-measure. That alone was an interesting experience!
But the questioning part wasn’t exactly normal and easy either. The majority of the questions were pretty normal like your height, age and name. These were all facts, unchallenged. There were also reaction and memory games that we had to play there. Quite a few of the questions were our opinions such as favourite ice cream flavour etc. One question was really weird. It asked us whether we think pineapple belonged on pizza or not. I think most people said no!
The data from the census could used for the good of our community in several ways. I personally feel that the census is very important and useful, because then the government is able to have the information to decide what will be for the best of our student community. For example, the government might think that building a netball court is for the best of our students, but it turns out that hardly anybody likes netball (note, this is a fictional example). That would be a serious waste of resources and would provide little enjoyment to our schools. That is why the census is important. So the government can gather all the provided data and decide the best way to spend their money. That is a much better option than randomly assuming what is going to be the most helpful thing.
A few weeks after the census, my class used the data in our maths lesson. We had been studying graphs and charts and wanted to use our learning to do a project. We gathered the data our class used and would then take two questions that was asked in the census. We would then ask a question related to the two of them. One example is "is the length of our right and left feet the same size?"
My partner and I chose the question "does the amount our bag weight affect the amount of time it takes to get to school?" We then used a software called CODAP to create a graph using the data we collected, analysed our data and formed our conclusions. That maths project was a fun, hard and memorable experience.
Gallery


