Maths is everywhere!
In number form, measurement, and statistics.
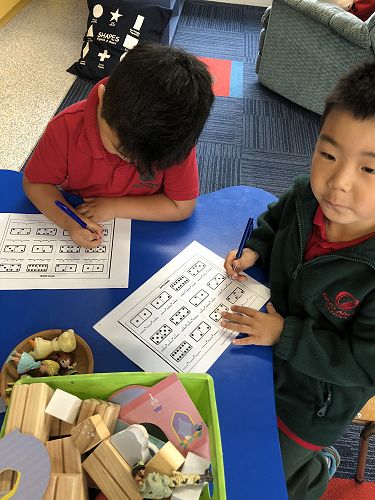
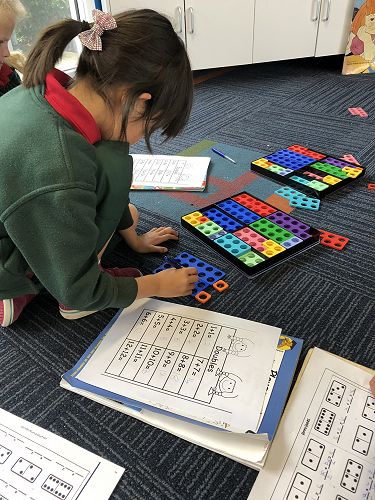
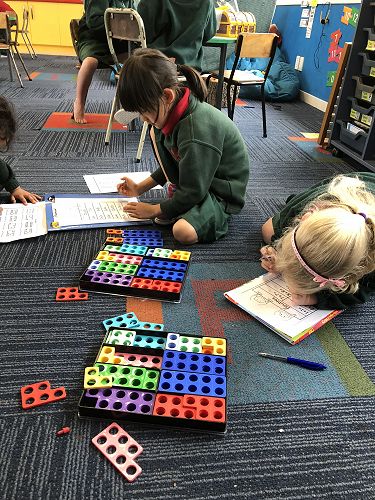
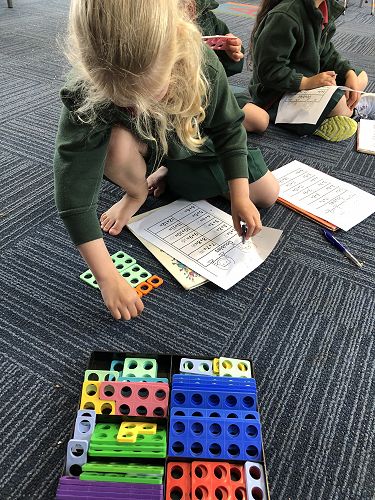
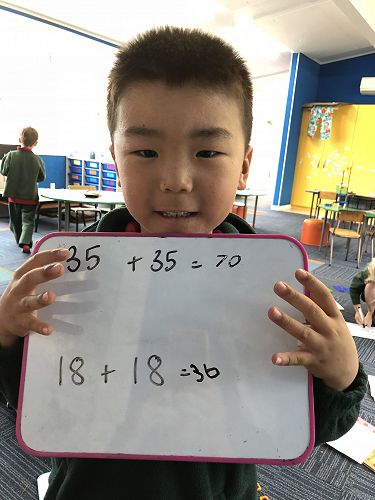
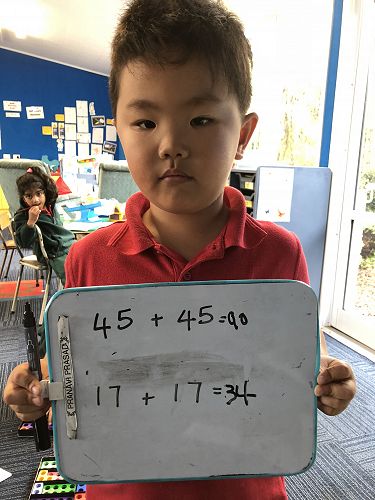
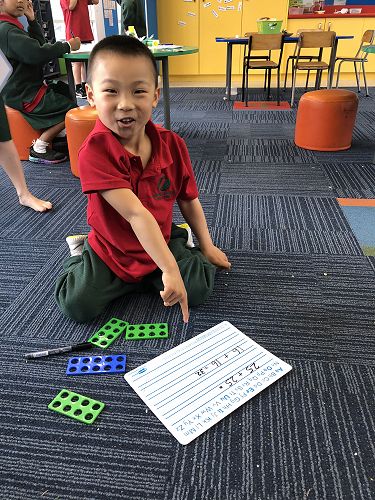
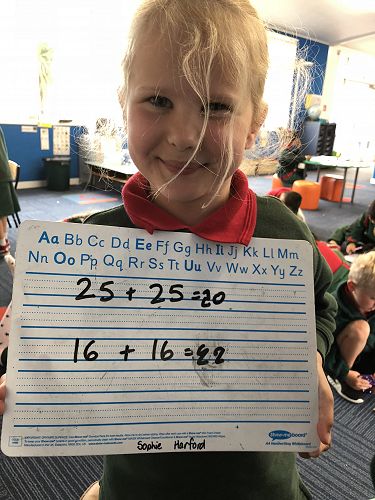
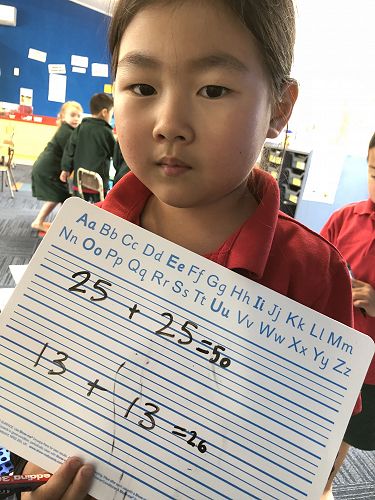
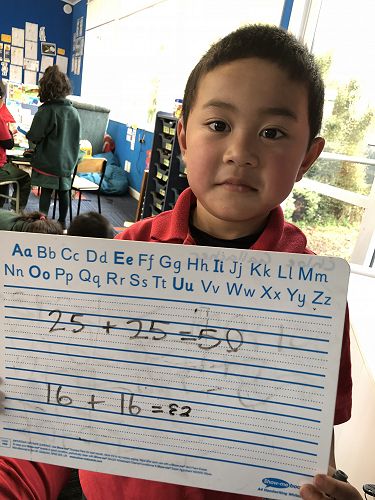
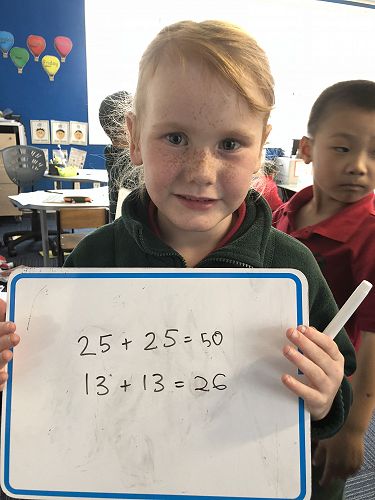
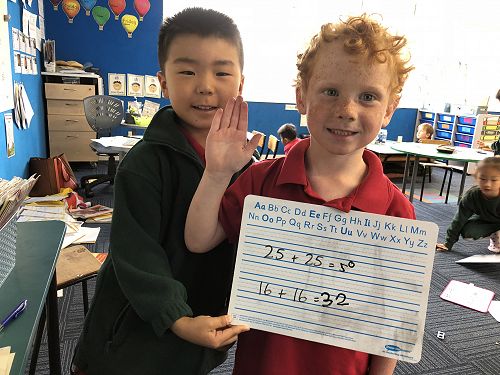
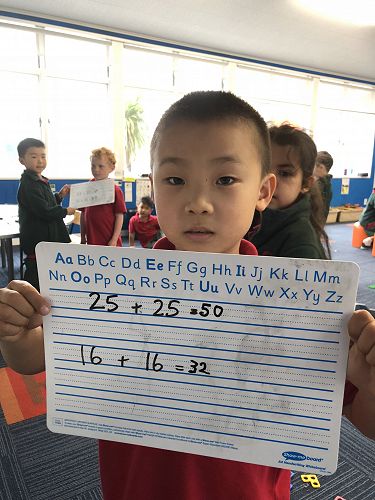
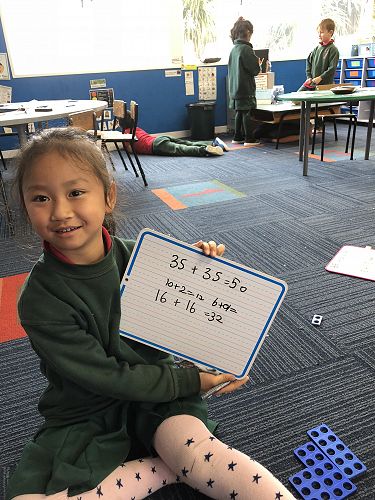
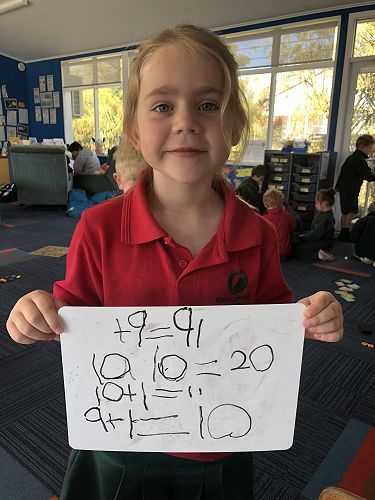
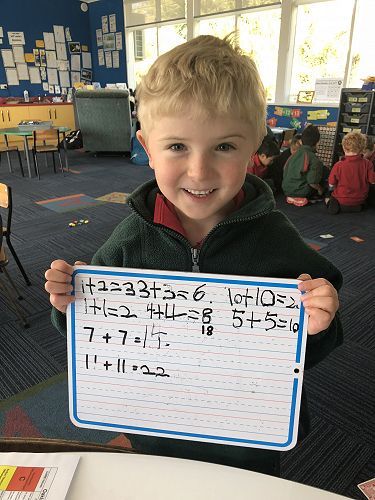
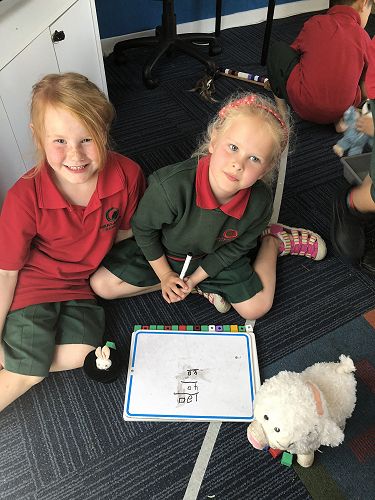
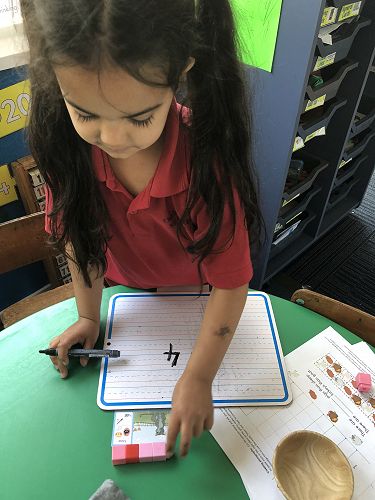
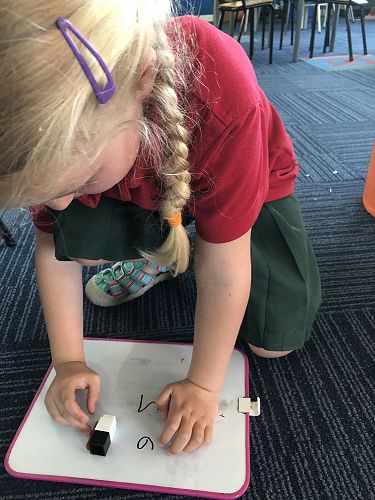
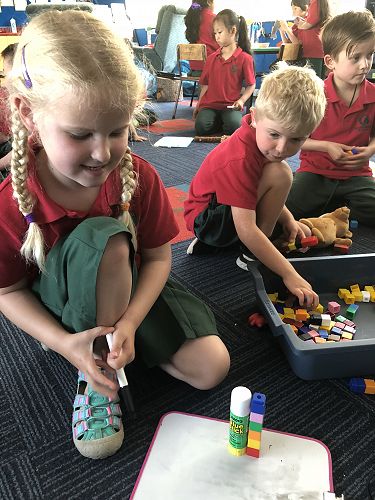
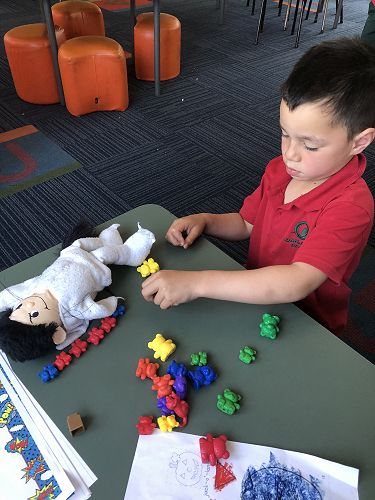
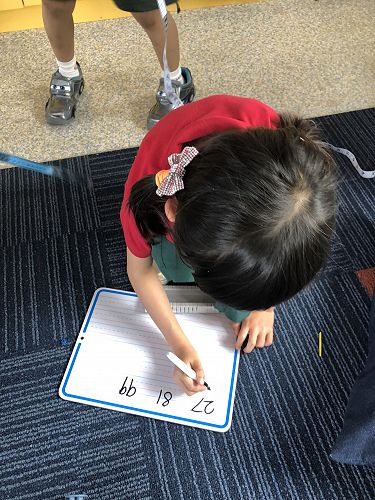
Adding doubles, such as 4+4 or 9+9, is one important strategy for learning addition facts. The great news about learning doubles is that there are just 10 of them to learn. Learning these 10 doubles will eventually carry over into children being able to add numbers like 22+22 with no problem. Knowing the doubles will also help children learn the "doubles neighbour" facts, such as 3+4 and 7+6.
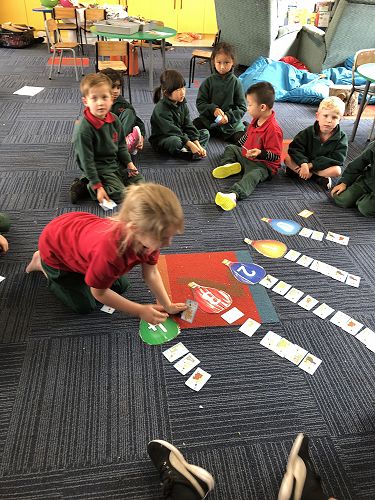
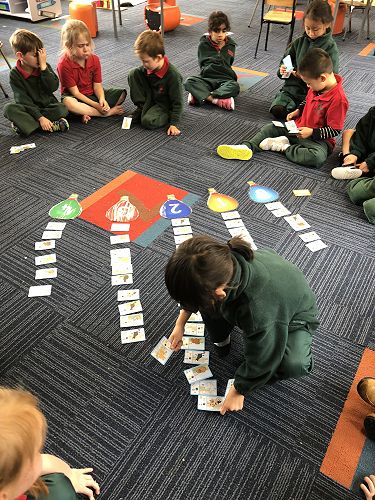
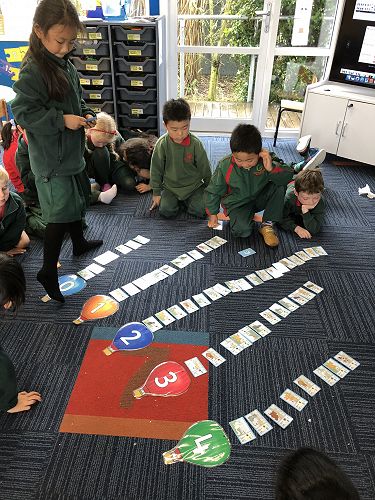
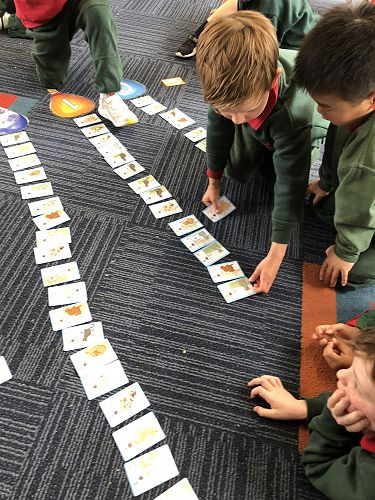
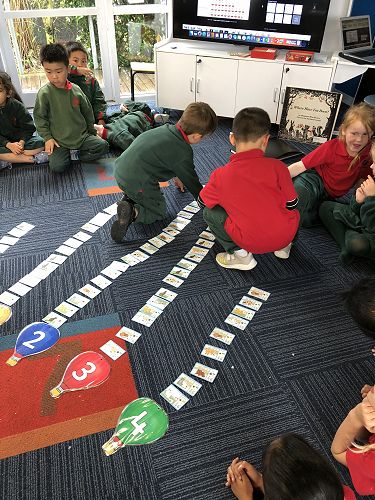
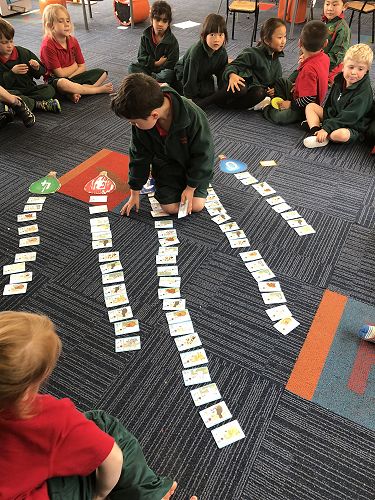
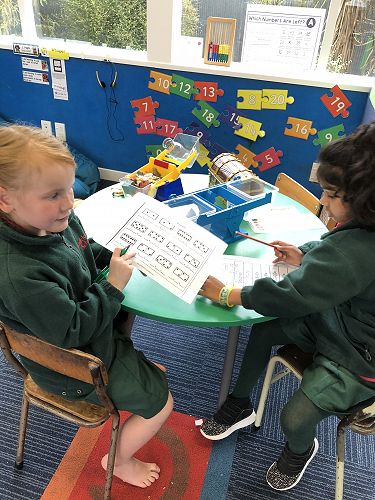
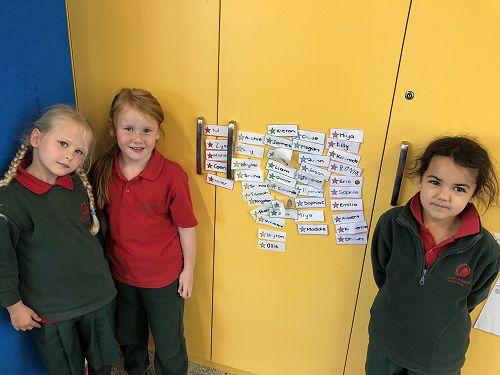
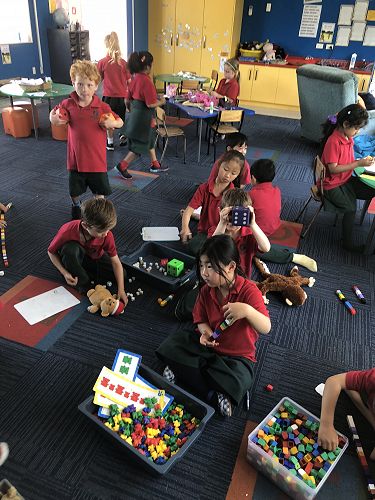
A pictogram is a chart that uses pictures to represent data. Pictograms are set out in the same way as bar charts but instead of bars they use columns of pictures to show the numbers involved. The children had fun putting a set of cat cards into categories and then interpreting the data. We also used shapes and put our knowledge into action with a sheet about bakery items.
How many more brown cats were there than white cats?
Did any categories have the same number of cats?
Which category had the least cats?
What category had the most cats? By how many?
I wonder what you can categorise at home? What data can you gather?
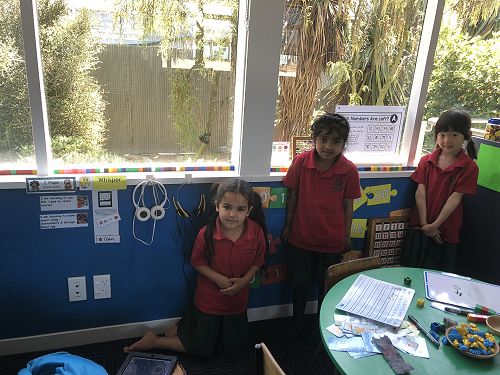
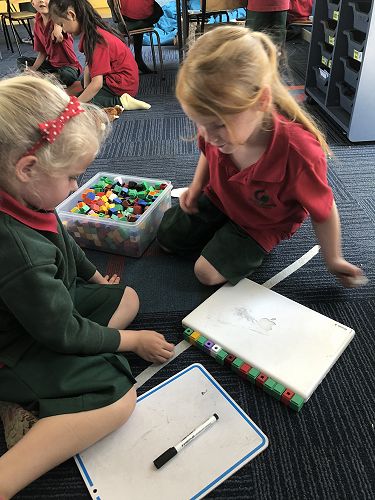
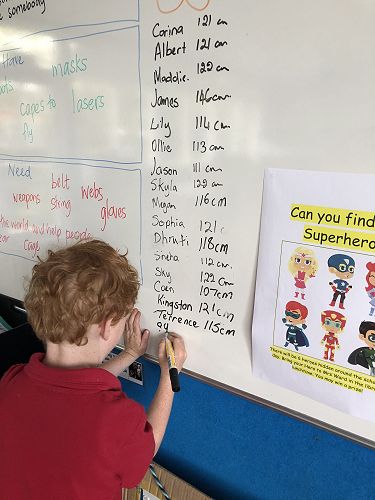
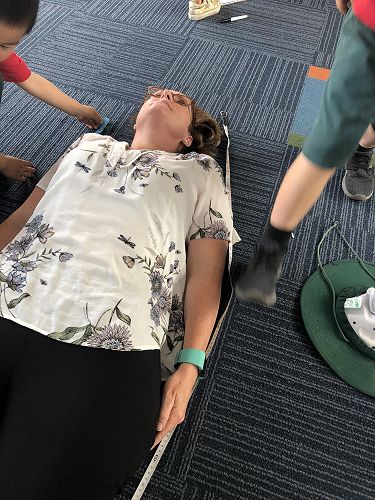
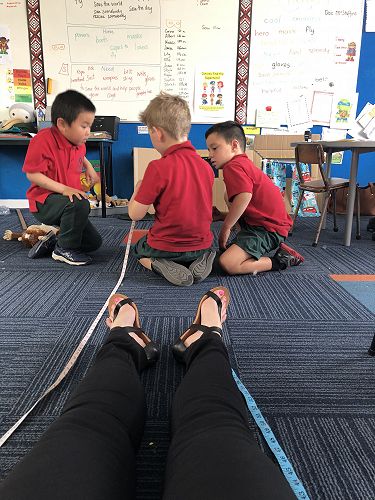
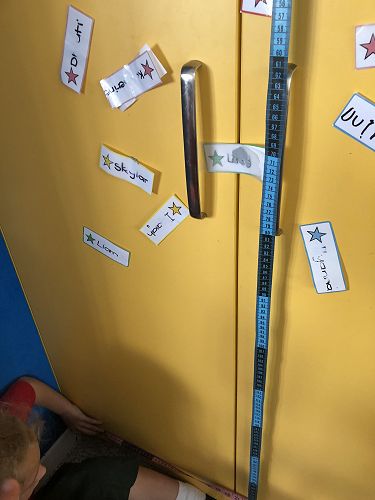
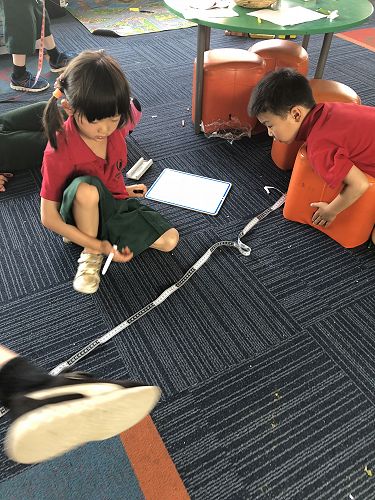
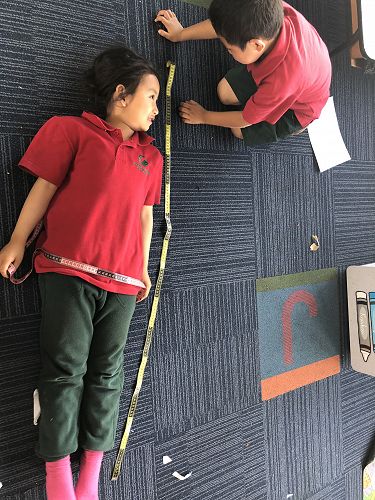
We have introduced measurement and asked what can we use to measure things? The children posed a statistical investigation question 'Who are the tallest and shortest in the whānau group? and 'How will we find out?'
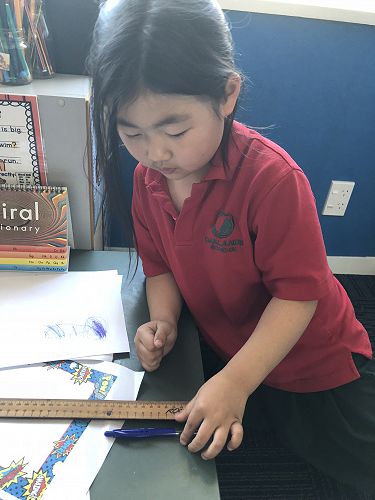
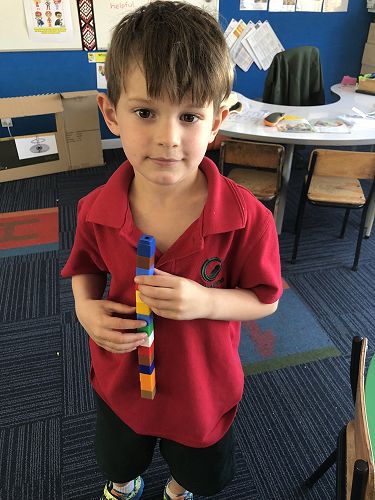
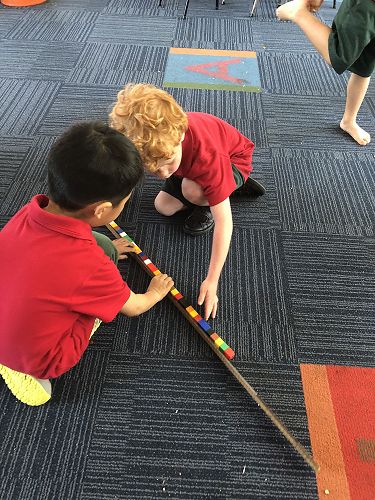
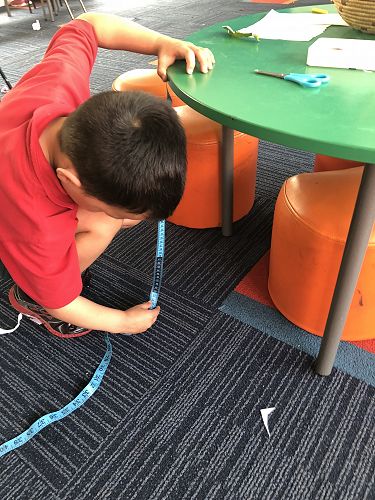
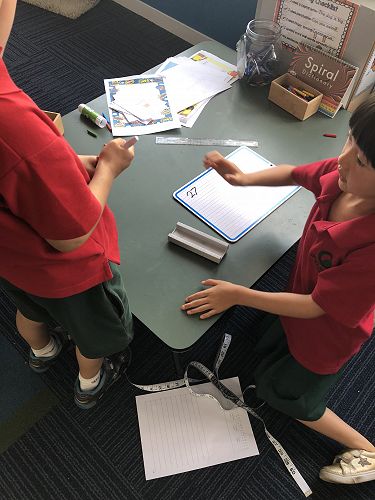
Tape measures were used and we found the height and length of many things in the learning spaces.
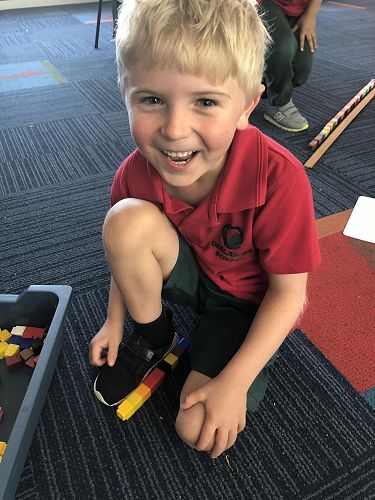
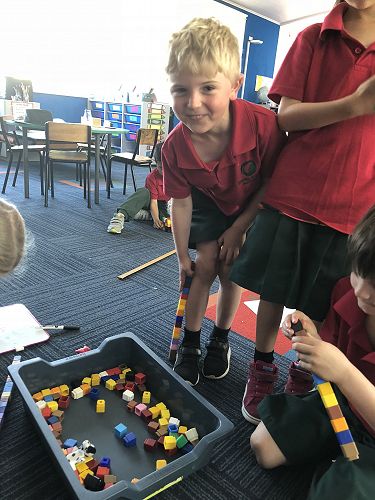
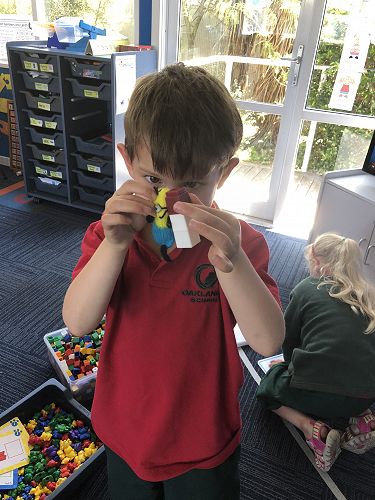
We know to measure length and height, you need to use a standard measure e.g cubes, matchsticks, big or small bears, meters and centimetres. We had fun doing this!
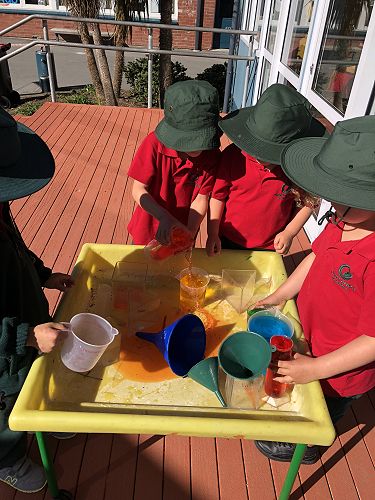
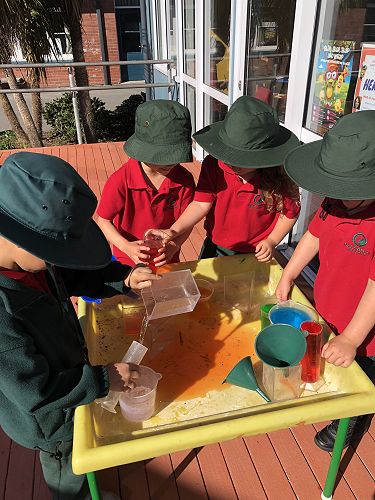
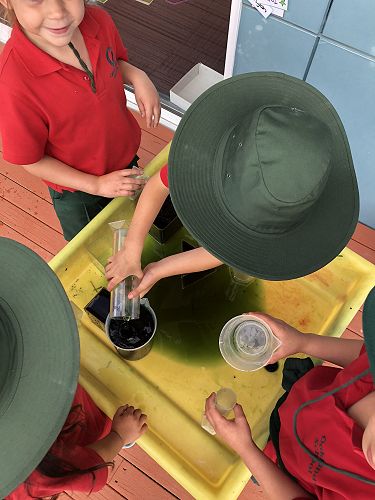
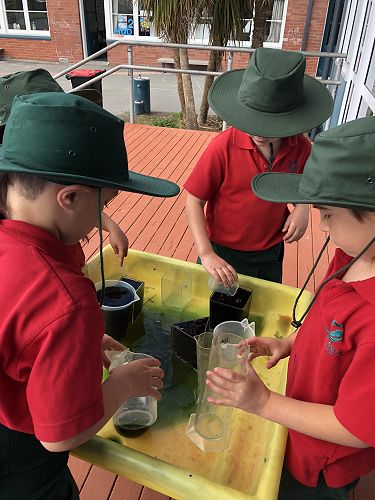
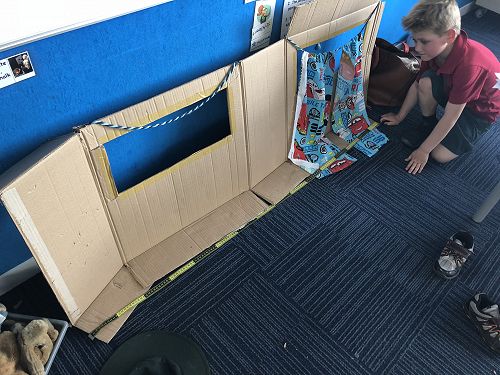
We also used our inquiry with measurement in volume using water and a variety of containers.
Gallery