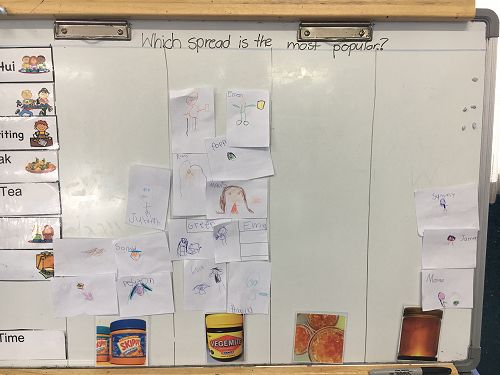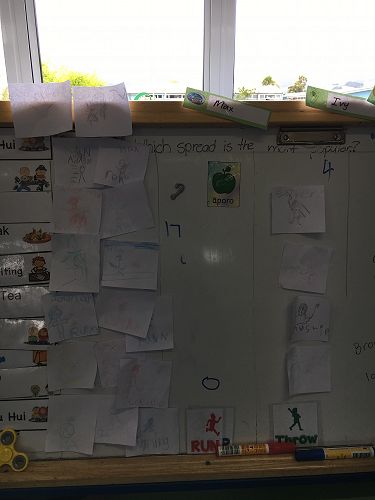
Using statistics to choose a spread....
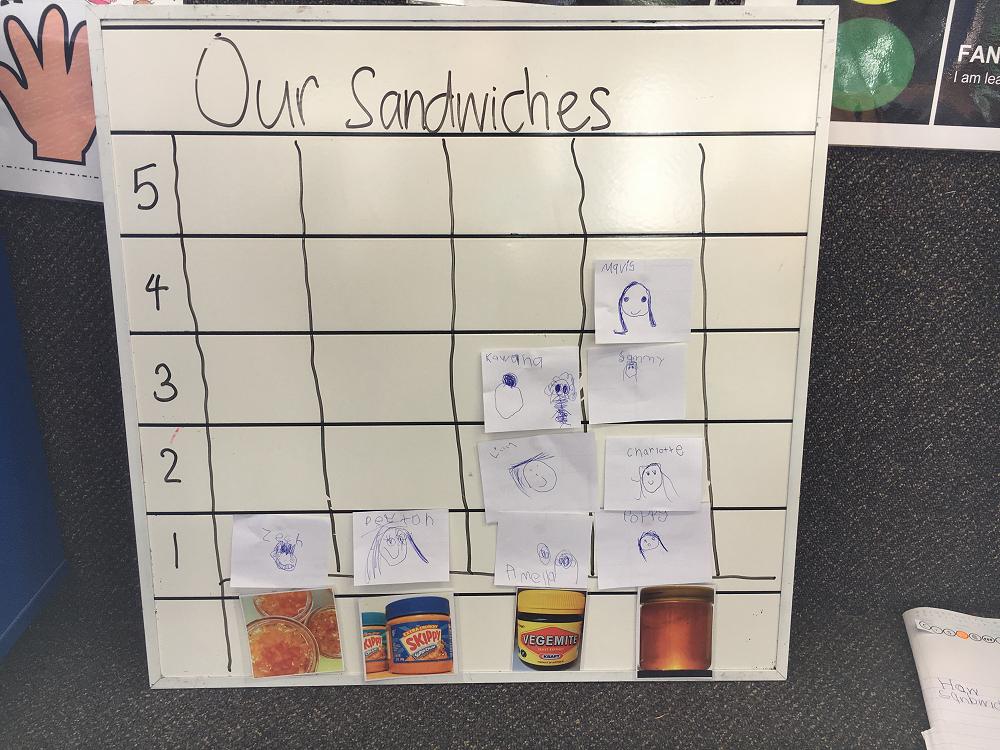
And the data tells us it is vegemite!
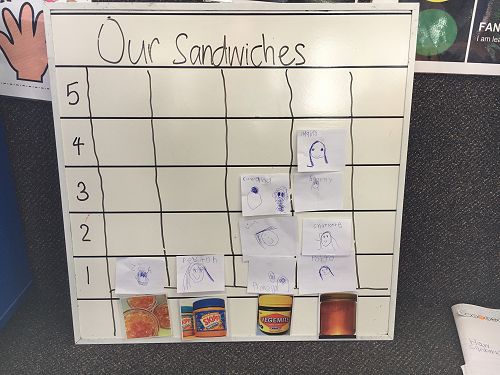
0/1 KC and RPH have been using bar graphs to gain data. The concept of bar graphs begins with hands on experiences and using objects that the children have previous knowledge with. Open investigation and exploration and time for questions and discussions are required.
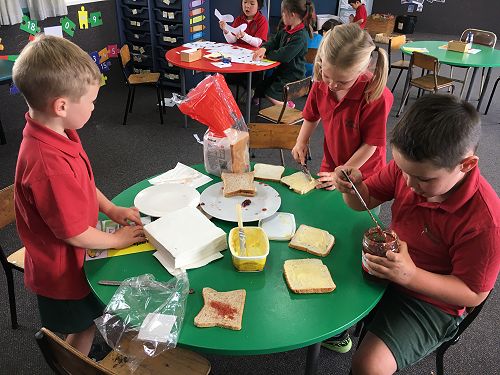
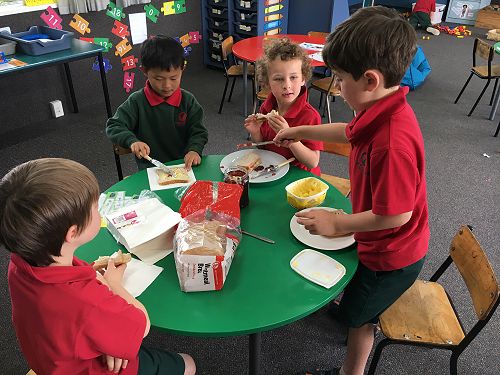
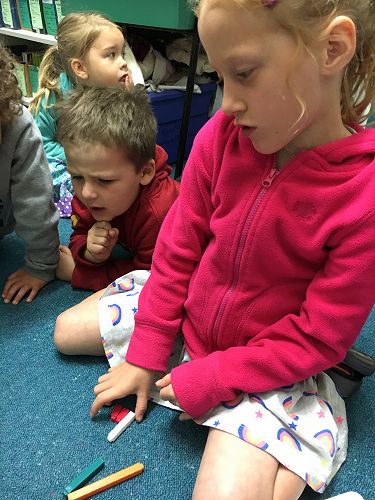
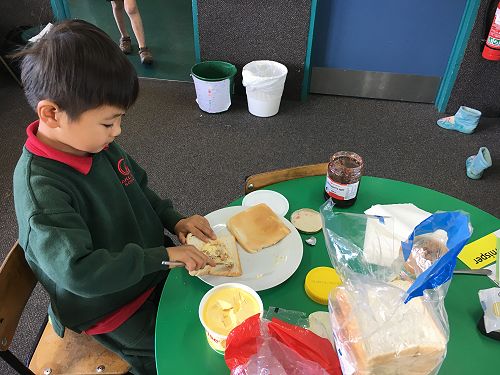
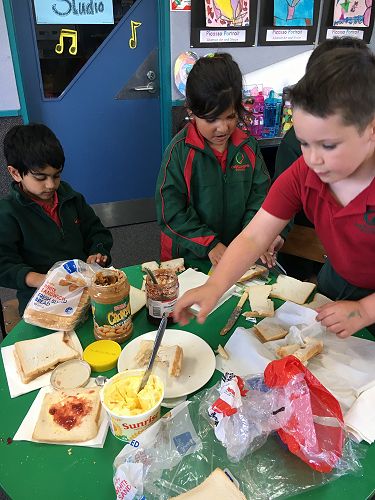
It started with the children writing instructions on how to make egg sandwiches. The extra resources were put on an Action Station and the children worked with their skills to make their own sandwiches.
It was a popular activity and we used the data from the bar graph to determine the next spread to be used. This activity reinforces real life skills; using equipment correctly, spreading the butter and spread and cutting the bread into fractions.
Developing life skills for children is a great way to encourage independence, practice fine-motor skills, and foster self-confidence.
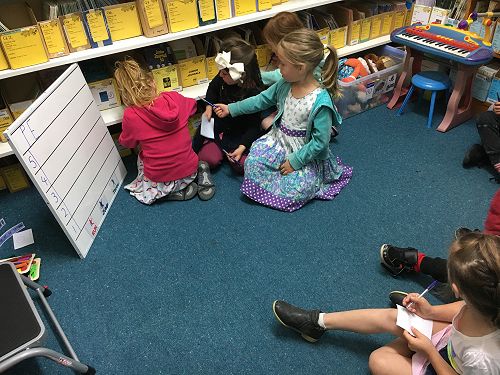
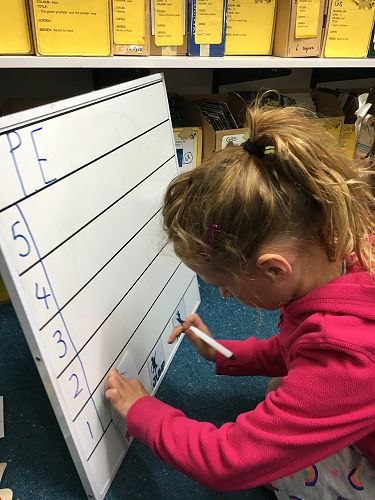
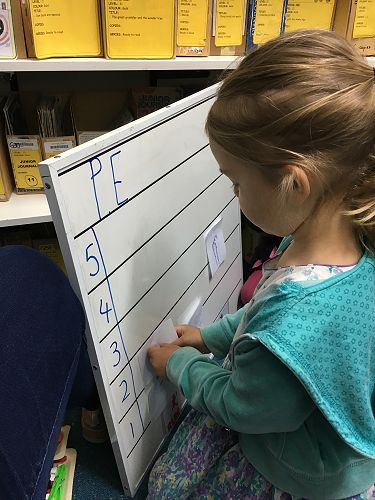
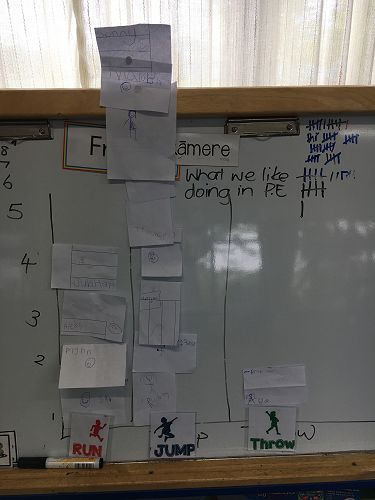
In P.E. we have started our training through the Run, Jump and Throw program. In Maths today, we used the bar graph data to see what area the children wanted to get better at. The data tells us the majority of children want to get better at running.
'Data tells us the numbers. The most popular is the one with the biggest number.' Charlotte
'A bar graph tells us the numbers, counting, so I can find out how much was in the bar graph.' Alex M
'Lots of people put their name on there and put it where they want and whoever has the most is the choice.' Jimmy
'We put our pictures on it to make the bar. Data is the numbers.' Amelia
'There are more people running in our bar graph.' Kawana
'A bar graph is for numbers and for some stuff you want to get better at.' Zech
Gallery